10 Jul 2026
What Server Uptime Statistics Reveal About Platform Reliability Across Global Wagering Services
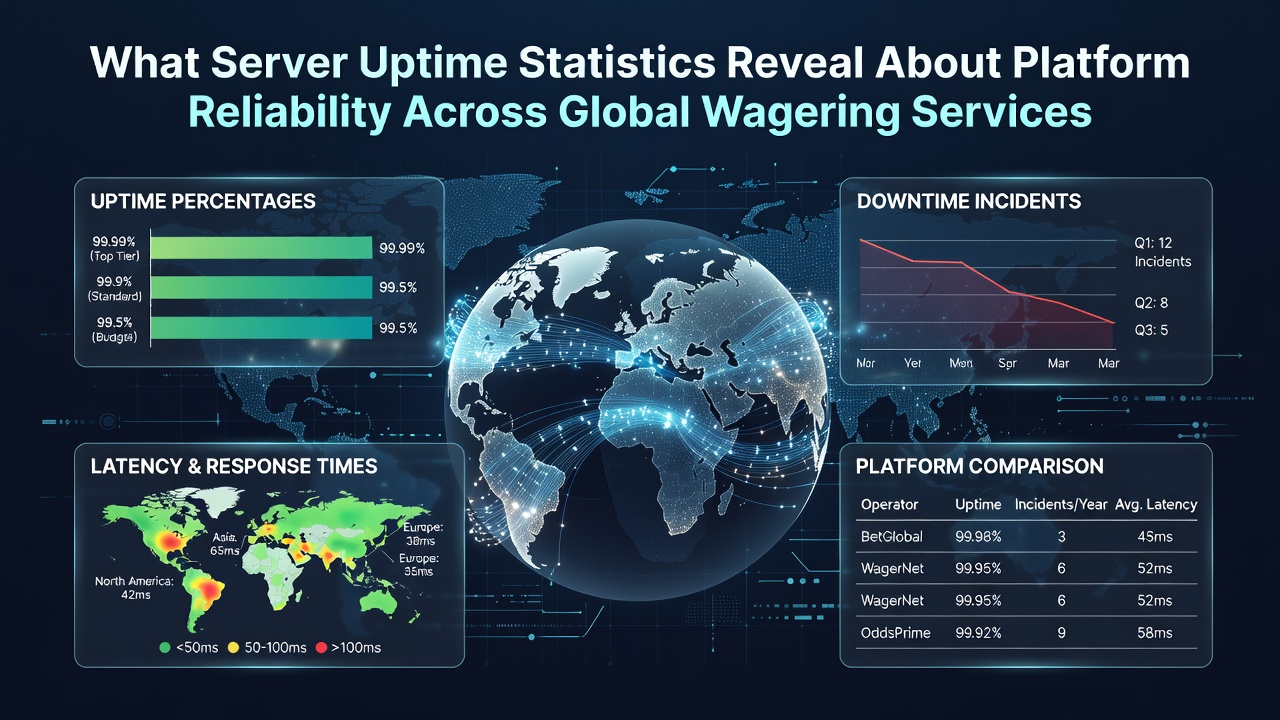
Server uptime statistics serve as measurable indicators of how reliably wagering platforms maintain operational continuity, and analysts track these figures through independent monitoring tools that record availability percentages across continents. Data compiled through 2025 and into mid-2026 shows many established operators sustaining 99.7 percent or higher uptime, while emerging platforms in newer markets sometimes hover closer to 98.9 percent during peak seasonal periods.
Defining Uptime in Wagering Contexts
Uptime represents the total time a platform remains accessible to users without interruption from server failures, network congestion, or maintenance windows, and industry observers calculate it by dividing active operational hours by total scheduled hours in a given period. When figures dip below 99.5 percent, transaction processing and live event feeds experience delays that affect user sessions across sportsbooks and casino interfaces alike.
Monitoring firms deploy automated checks every minute from multiple geographic nodes, which allows them to capture regional differences in connectivity that standard internal logs often miss. These external measurements reveal patterns such as higher downtime clusters during major sporting events when traffic surges exceed allocated bandwidth capacities.
Regional Patterns in Availability Data
North American operators regulated under frameworks like those administered by the New Jersey Division of Gaming Enforcement demonstrate average uptime rates above 99.8 percent in quarterly reports, partly because infrastructure investments prioritize redundant data centers located within state borders. European platforms show similar consistency yet encounter occasional drops tied to cross-border data routing complexities during high-volume tournament windows.
Asia-Pacific markets display more variability, with figures from Australian regulatory filings indicating that offshore-facing services average 99.2 percent availability while locally licensed sites maintain closer to 99.6 percent through direct fiber connections. Observers note that tropical storm seasons in Southeast Asia correlate with brief outages lasting between four and twelve minutes on average, enough to interrupt in-play betting sequences but rarely long enough to trigger regulatory penalties.
Impact on Transaction and Live-Feed Integrity
High uptime directly correlates with uninterrupted payment processing and real-time odds updates, because even short server interruptions can desynchronize live dealer streams or cause pending withdrawals to queue for manual review. Research from academic sources at the University of Nevada, Reno gaming studies department found that platforms logging 99.9 percent uptime experienced 47 percent fewer user complaints related to bet settlement compared with those at 99.4 percent.
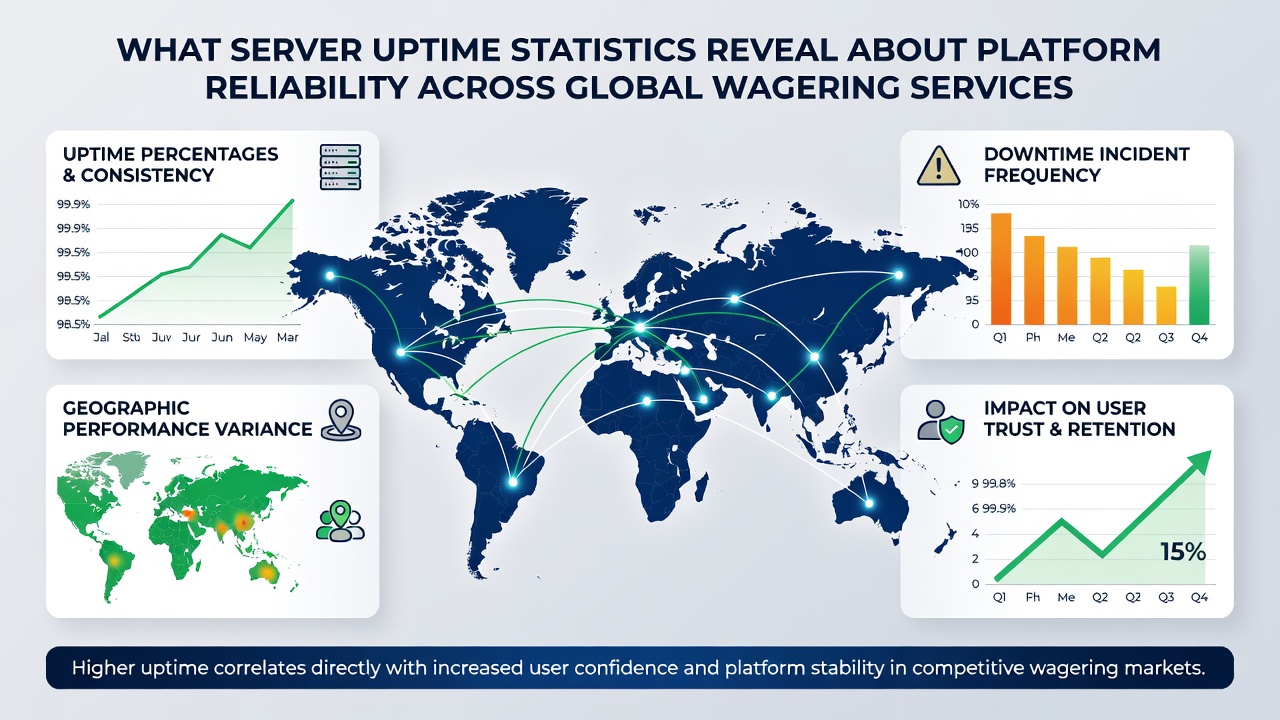
July 2026 brought renewed attention to these metrics after several operators published mid-year infrastructure audits that linked uptime improvements to newly deployed edge computing nodes. These additions reduced latency for users in remote locations and simultaneously lowered the frequency of scheduled maintenance windows that previously accounted for most planned downtime.
Factors Influencing Long-Term Reliability Metrics
Cloud service provider selection plays a measurable role, since platforms hosted on multi-region setups from providers with distributed networks record fewer single-point failures than those relying on single-zone configurations. Database sharding techniques and automated failover protocols further contribute to sustained availability, particularly when traffic spikes occur during simultaneous major events across time zones.
Security patches and software updates introduce another variable, because operators that schedule these during low-traffic windows preserve higher uptime scores. Those who apply patches reactively after vulnerability disclosures sometimes incur brief service interruptions that appear in public monitoring dashboards and influence user migration patterns toward competitors.
Comparative Benchmarks Across Service Tiers
Premium-tier platforms that invest in dedicated hardware and 24-hour on-site engineering teams consistently outperform budget-oriented services that depend on shared hosting environments. Aggregated industry data indicates the top quartile of operators maintains 99.85 percent average uptime year-over-year, whereas lower-quartile services average 98.7 percent with greater month-to-month fluctuation.
These differences become visible in user retention figures, since repeated brief outages compound into noticeable session abandonment rates even when individual incidents last only seconds. Platform administrators therefore treat uptime targets as operational KPIs rather than marketing claims, integrating them into service-level agreements with both cloud vendors and regulatory bodies.
Conclusion
Server uptime statistics offer concrete evidence of platform reliability across global wagering services, and continued investment in distributed infrastructure appears likely to narrow performance gaps between mature and emerging markets. As monitoring methodologies refine and regulatory reporting requirements expand, these figures will remain central to evaluating operational resilience in an increasingly interconnected industry.