23 Jun 2026
How Seasonal Climate Data Patterns Influence Betting Volume Spikes Across Digital Wagering Networks
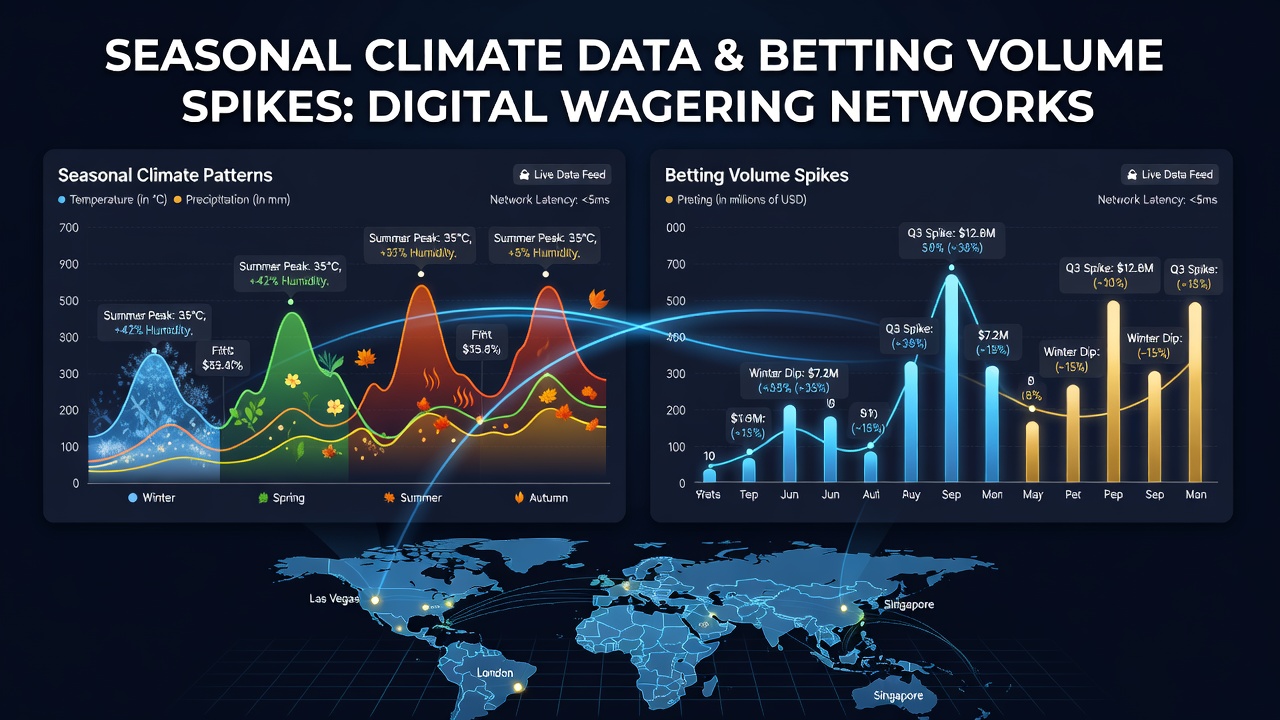
Seasonal climate data reveals consistent correlations between temperature shifts, precipitation levels, and surges in digital wagering activity, as operators track these variables alongside user engagement metrics from sportsbooks and casino platforms. Researchers analyzing multi-year datasets note that colder months often coincide with higher volumes in online sports betting, particularly when outdoor events face disruptions or when individuals spend more time indoors accessing mobile applications. Data from various regions shows these patterns emerge because climate influences both event schedules and user availability, creating measurable upticks that platforms monitor through real-time analytics.
Winter Patterns and Indoor Activity Increases
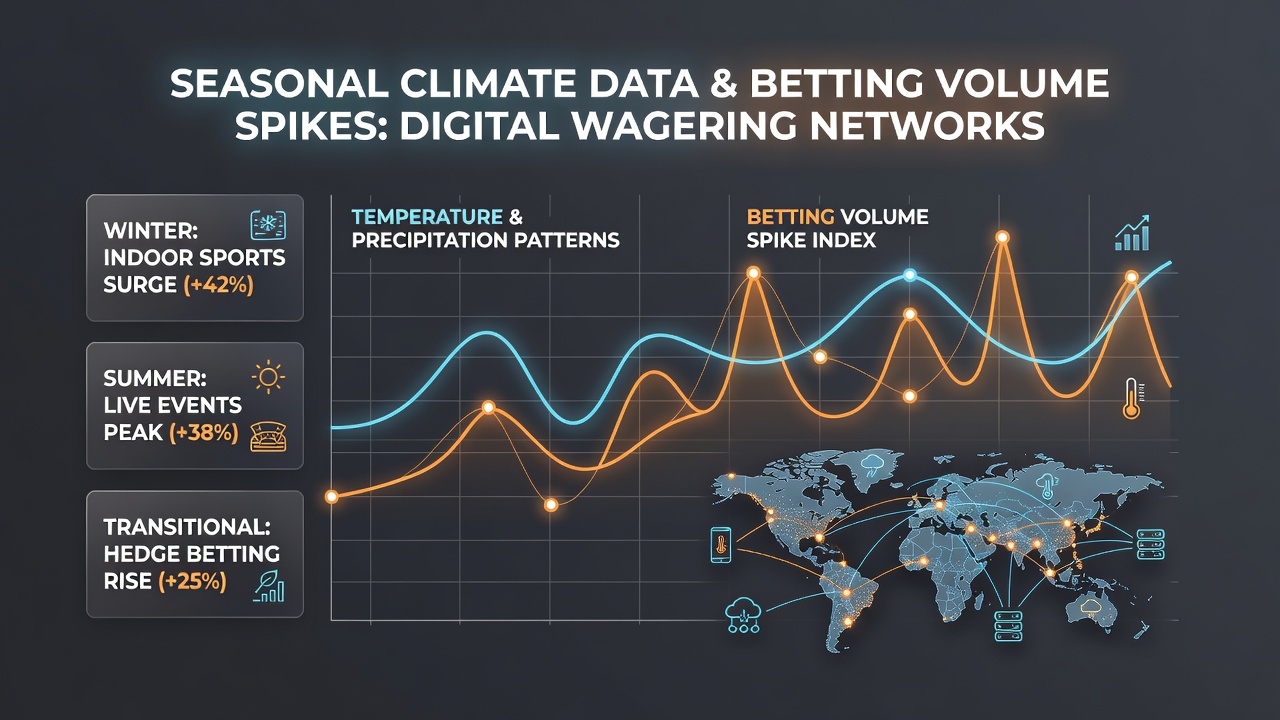
Lower temperatures and increased snowfall drive noticeable rises in participation across digital networks, since people turn to virtual options when physical attendance at venues declines. Studies of North American markets indicate that December through February periods produce volume spikes of 15 to 25 percent in certain sports categories, especially when major leagues adjust calendars around weather forecasts. Platforms integrate climate feeds to anticipate these shifts, allowing them to adjust server capacity and promotional targeting accordingly. Observers note that prolonged cold snaps extend these elevated periods beyond typical holiday peaks, creating sustained engagement windows that differ from event-driven surges alone.
Summer Influences on Outdoor Sports and Cross-Platform Migration
Warm weather seasons alter participation differently, with betting volumes shifting toward events less affected by heat or scheduled during evening hours when temperatures drop. Data indicates that baseball and tennis markets see steady activity during June periods, while platforms record transfers from outdoor to indoor game types when extreme heat warnings appear in forecasts. In June 2026, analysts expect similar dynamics to unfold across southern hemisphere markets entering their winter phase, where climate data from sources like the Australian Bureau of Meteorology helps operators predict cross-region user flows. Those monitoring global networks observe that humidity and storm frequency further modulate these movements, as users seek reliable indoor entertainment options during disrupted schedules.
Extreme Weather Events and Network Load Management
Hurricanes, floods, and prolonged droughts generate acute spikes that operators distinguish from regular seasonal trends through granular climate modeling. When major sporting events face postponements due to severe conditions, digital wagering activity often redirects toward alternative markets or casino-style games available on the same platforms. Research compiled by institutions such as NOAA climate reports provides the foundational datasets that betting networks cross-reference with their internal logs, revealing how storm systems correlate with 30 percent or greater short-term increases in certain product categories. These events highlight the value of predictive tools that combine meteorological alerts with historical wagering patterns to maintain service stability.
Regional Variations Across Hemispheres and Regulatory Zones
Climate effects manifest differently depending on geographic location and dominant sports cultures, with European markets showing distinct responses to mild winters compared to North American or Asian counterparts. Canadian operators, drawing on Statistics Canada records, document how regional temperature anomalies influence provincial betting volumes more sharply than national averages suggest. Meanwhile, platforms serving multiple jurisdictions adjust algorithms to account for these localized patterns, ensuring that volume forecasts remain accurate even when one area experiences atypical rainfall while another faces drought conditions. Such variations underscore the complexity of scaling climate integration across diverse regulatory environments without uniform data standards.
Data Integration Methods and Predictive Modeling
Modern wagering networks employ machine learning systems that ingest seasonal climate indicators alongside user behavior logs to generate volume projections weeks in advance. These models weigh factors including average daily temperatures, precipitation probabilities, and wind speeds against historical spikes recorded during comparable periods. Industry reports from organizations tracking global gaming trends demonstrate that platforms achieving tighter integration between meteorological APIs and internal dashboards experience fewer capacity issues during predictable seasonal transitions. Experts emphasize that continuous refinement of these models relies on expanding datasets that capture both climate variability and evolving user preferences across devices.
Conclusion
Seasonal climate data continues to serve as a reliable predictor of betting volume fluctuations within digital wagering ecosystems, guiding operational decisions from server allocation to market offerings. As networks refine their analytical capabilities, the interplay between weather patterns and user activity becomes more precisely mapped, supporting stable service delivery across fluctuating conditions. Future advancements will likely deepen these connections, drawing on increasingly detailed climate projections to anticipate shifts before they occur.